We made SunSpot: an app to monitor 300 megawatts of residential solar
TL;DR
Geocene created SunSpot for California’s Solar on Multifamily Affordable Housing (SOMAH) Program. SOMAH will provide $1B in financial incentives over the next decade to build, install, and monitor 300 megawatts of residential solar built on multi-family affordable housing. Since there are a variety of contractors installing dozens of different solar hardware configurations, we built a tool to collect, analyze, and display the data from all those installations. SunSpot brings all the metadata and real-time solar production data from SOMAH into one organized and beautiful web app. Now SOMAH Program Administrators (PA) can oversee this massive program and ensure that each individual project is accountable and successful.
How it started
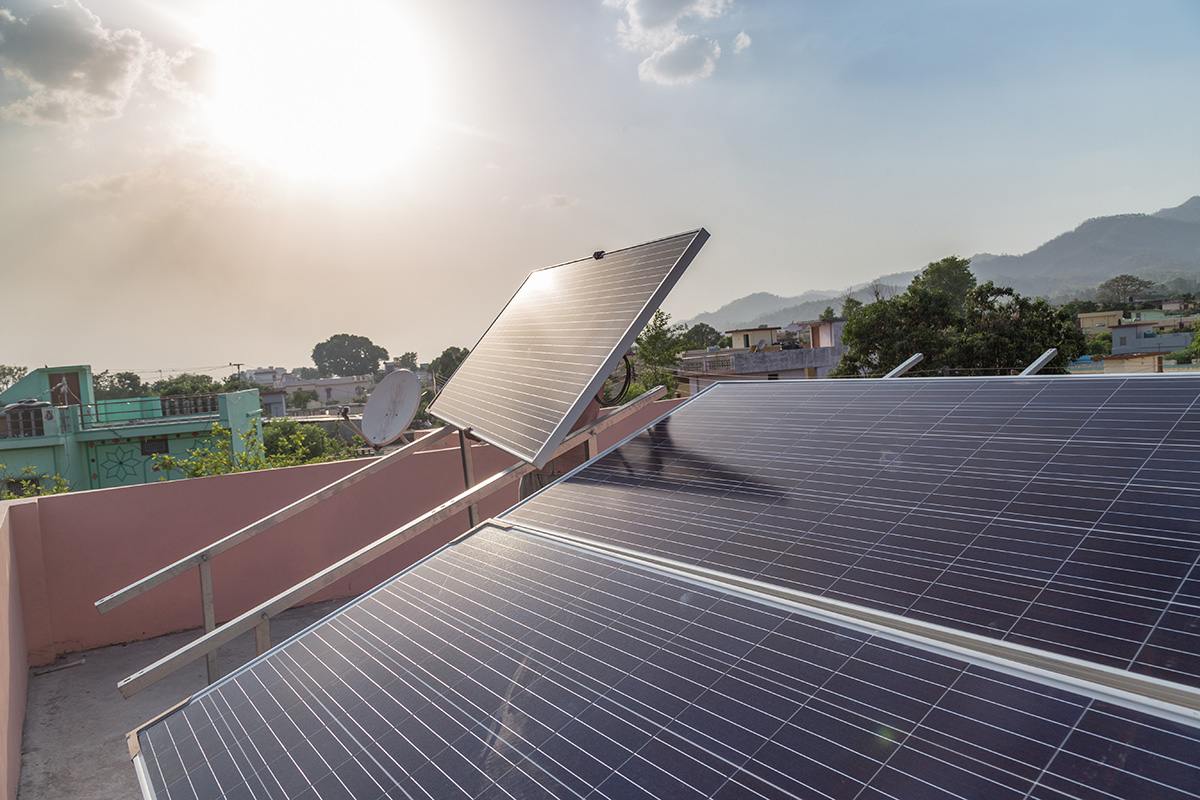
The SOMAH Program is California’s Solar on Multifamily Affordable Housing initiative. Its mission is to provide financial incentives for installing solar panel systems that benefit affordable housing residents and property owners throughout California. This massive $1 billion program aims to install 300 megawatts of residential solar by 2030, distributed over approximately 2,000 separate properties and projects. SOMAH intends to track the performance of all of these installations for accountability, post-installation technical assistance, and impact assessment.
💡 The SOMAH Program provides $1 billion in financial incentives for installing 300 megawatts of solar panel systems that benefit affordable housing residents and property owners throughout California. Geocene built the software platform, SunSpot, to monitor it all.
GRID Alternatives, a member of SOMAH’s nonprofit program administrator team based in Oakland California, led an effort to acquire a monitoring solution to ensure that the funded solar projects meet their production targets. Although this sounds simple, the technical challenge for SOMAH was not. The solution had to integrate with scores of contractors, dozens of different solar hardware and software companies, and eventually manage data from two thousand projects across the state, all in real time, in one place. In other words, herding cats.

After collecting all the necessary data, SOMAH needed to analyze, summarize, and present it in a way that program managers could easily interpret and take action on for the next decade. There were no viable or affordable commercially-available solutions to SOMAH’s problem. That’s when the SOMAH PA team contacted Geocene for help.
What was needed
Manually tracking two thousand individual solar systems across a dozen different inverter APIs for a decade would be impossible. An automated software monitoring solution was necessary to collect data from multiple sources and display it on an easy-to-read UI while remaining stable for many years. The system needed to:
- Digest the public SOMAH dataset to identify completed projects.
- Pull additional project metadata from a private API.
- Geocode individual addresses.
- Estimate seasonal generation based on panel orientation, tilt, latitude, and longitude.
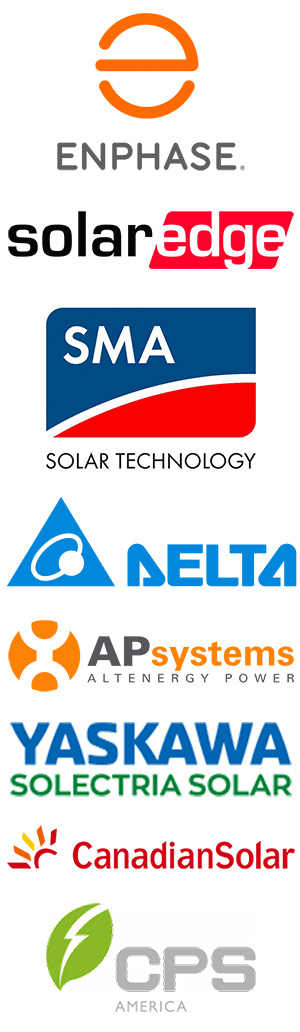
- Fetch up-to-date generation information for each project across these hardware vendors and APIs:
- Calculate and aggregate system performance compared to the estimates.
- Display all of this information so that it can be readily understood at a glance across one thousand projects.
What we made
After working with the SOMAH PA team to gather requirements, we answered the most important question: what would we call the app? Solution: SunSpot!
Whew, with that out of the way, we moved on to the easy stuff: stability. The software was going to need to work for ten years. Ten years is a long time in dog years, but even longer in computer years. Ten years ago, Facebook had its IPO and bought a small startup called Instagram!
Predicting which platforms, programming languages, software libraries, and devices of today will still be around in a decade took some thought. We also wanted to leverage existing solutions as much as possible to complete the dashboard in a reasonable timeframe.
Even with our best efforts into predicting the tools that would stick around, modularization would be key. We settled on Django for the backend and Plotly Dash for the frontend. Both of these libraries are written in Python which will make finding developers in the future easier. It also allows us to do aggregation on both the frontend and backend depending on what makes the most sense using Python data science libraries like NumPy and Pandas. It is hosted on AWS which was founded way back in 2006. All web integrations can be replaced by rewriting just the one “driver” that is needed. For example, we convert addresses to latitude and longitude pairs through the Google Maps Geocoding API, but we could switch this to any other service by only changing one file.
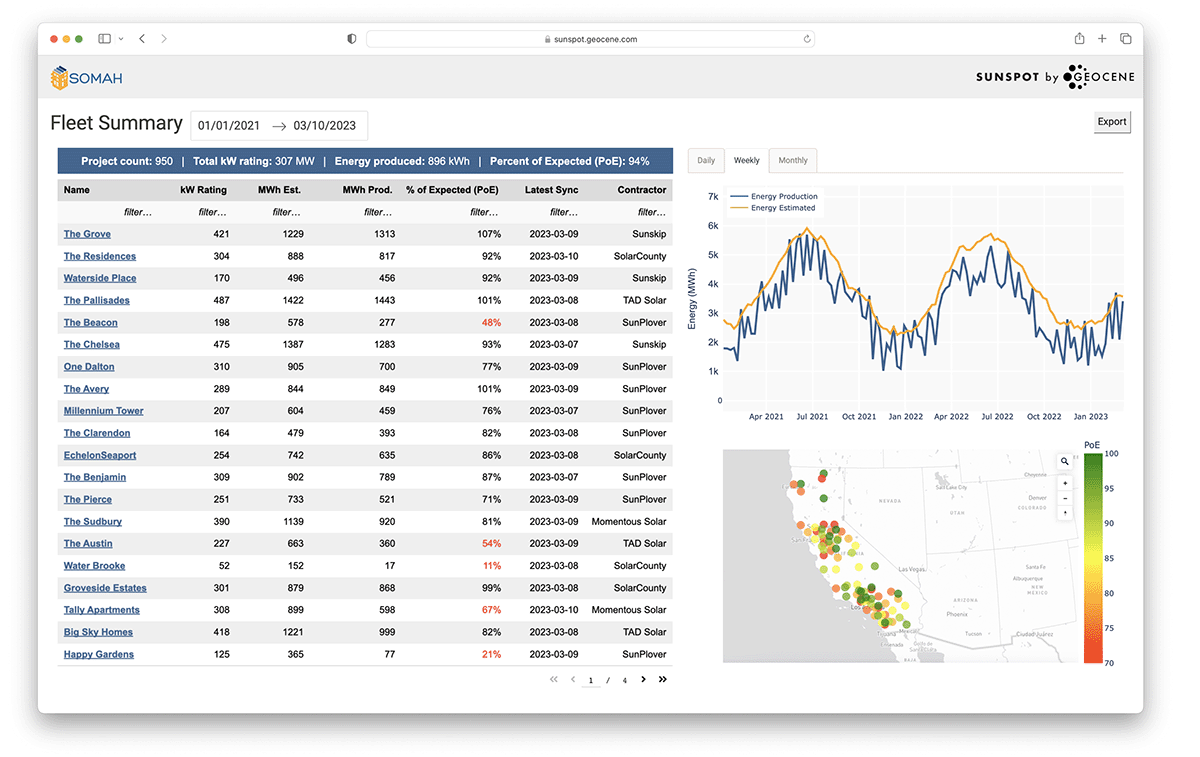 A screenshot of the SunSpot web app. The data displayed is synthetic testing data.
SOMAH’s use cases mainly involve filtering data based on time ranges and metadata and then visualizing fleet performance on a map and chart. To achieve this, we developed a robust search-and-sort table enabling users to sort and filter by any solar production or metadata. For instance, if you want to see only the projects completed by Sunrun with a rated output of over 100 kW, filter on the contractor and kW rated columns. If you want to view all the projects that produce less than 70% of their expected output in summer 2022, use <70 in the Percent of Expectation column with the appropriate date range selected.
These dynamic filters and fast queries update the dashboard’s data interactively. This interactivity allows you to ask important questions of the data such as “who are my under-performers?”, “where in California are projects underperforming?”, and “are things getting better or worse over time?”
How it’s going
As of March 2023, SOMAH has accepted 724 applications and completed 84 projects. Geocene launched SunSpot in early 2022, and we’re proud of it’s reliability. The system has been running smoothly, allowing us to remain hands-off. Seeing more solar projects added as SOMAH grows and matures is exciting. The SOMAH PA has successfully used this platform to monitor their projects and contact and fix underperforming projects when necessary. We find observing the daily and seasonal changes to the data as rainy days and seasons come and go to be particularly enjoyable.
Want this or something like it for yourself?
Do you need SunSpot for your own solar project? Another solar data collector? An API integration? One dashboard to rule them all? We build that! Contact us and talk with a real human being (probably Danny, visionary creator of the name “SunSpot”) today!
Learn more about SOMAH
- Main website for SOMAH
- Business wire press release: California’s Solar on Multifamily Affordable Housing (SOMAH) Program to Begin Accepting Applications
- Directly access and download the SOMAH Working Data Set
- For questions about SOMAH call (858-244-1177 ext. 5) or email (contact@calsomah.org)
- For questions about SunSpot call (707-297-9641) or email (info@geocene.com)